Spatial + Exploratory Analysis
Demolitions by year
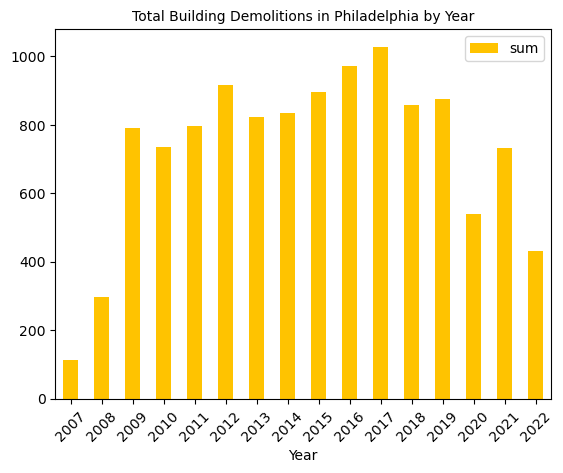
Matplotlib is used to visualize this data to show a clear and simple overview of high level information regarding building demolition. As a result of showing total demolitions by year, a bar plot easily depicts this data to compare the years side by side and identify trends.
The data shows that 2017 has seen the greatest numver of building demolitions totaling slightly above 1,000. Another point of interest of this chart shows a drastic increase in demolitions from 2008 to 2009, as well as a notable decrease in 2020 which may be attributed to COVID-19.
Spatializing building demolitions
Visualizing building demolitions by census tracts on a map allows viewers to see if there are any spatial relationships with demolitions to determine if there are particular areas that are more likely to experience demolitions.
From 2007 to 2022, census tract 169.02 has seen the greatest number of building demolitions at 254. The plot shows that a majority of demolitions have occurred in the census tracts just north of Center City.
Demolitions by year
Matplotlib is used to visualize this data to show a clear and simple overview of high level information regarding building demolition. As a result of showing total demolitions by year, a bar plot easily depicts this data to compare the years side by side and identify trends.
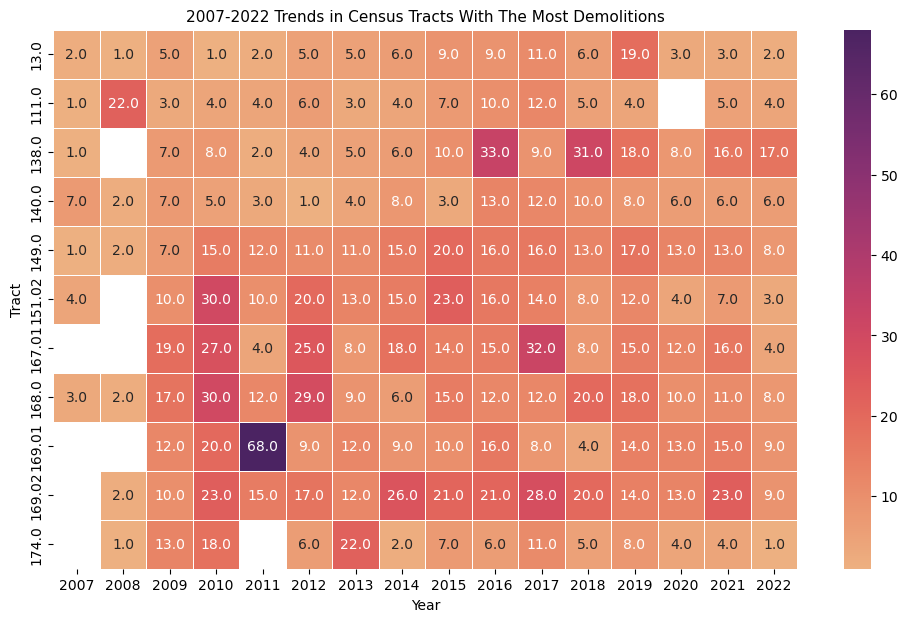
Looking at just the top census tracts, census tract 169.01 in 2011 sticks out with the largest amount of building demolitions at 68. Additionally of the top census tracts, 2010 sticks out as a year with many building demolitions simply by the amount and consistency of the darker color of the cells.
Change over time
Another way to visualize the data is by creating a brush plot that allows for interactivity to see building demolitions over time in the individual census tracts.
The plot shows the extreme increase in demolitions in tract 169.01 in 2011. The plot also visualizes consistent and comparitively more demolitions in tracts 167.01, 168, and 169.02 than the other tracts.
Census tracts with the most demolitions
After further analyzing individual census tracts, I now want to see what share of demolitions the top census tracts had by year using a stacked bar plot. This method allows for color coding visualizing the census tracts within each year while comparing across years and an interactive tool to exactly see the exact number of demolitions.
This plot reaffirms that in 2011, census tract 169.01 saw a major increase in building demolitions when compared to the rest of the years. Although tract 169.01 experienced drastically more demolitions in 2011, year 2010 also sticks out as the year with the greatest building demolitions for the top census tracts.